Those of you who have read or at least skimmed your eyes over the famous Steven Skienna book: “The Algorithm Design Manual” will possibly recognize the title.
A War Story in that book, for those of you who are unaware of it, is a short story describing how Skienna and some of his students solve real-life company or corporation problems using standard algorithms with some twists and tricks that we all use here in Long Contests…
Today (and I assume that’s a good thing!) I have experienced my first War Story… While I was having breakfast, my dad told me about a problem he and some of his thesis students are facing… So, he came to me for help…
He and all of his students are Civil Engineers who work on a more theoretical and research field if you like to call it like that, and, according to my dad, he and his student are studying vibration data of a large portuguese dam, such that for a given time period they have the amplitude of the oscillations of the dam over time, so they have a function which is:
f(t) -> returns the amplitude of dam's oscillations at time t.
Now they are interested in studying the times when the dam oscillates the most according to some specified parameters (for example, they might want all the oscillations which are evenly spaced in time, or, they might want all the “interesting” oscillations that occur above a given cutoff oscillation value, etc, etc).
The main issue they are facing, is that usually the graph they can plot is obtained from experimental data and, as such, some values are always affected by some error, or, in Signal Processing theory, the graph they plot is full of “noise”, i.e., very small ambient-dependent oscillations they might want to ignore or discard, since they label them as “not-interesting”.
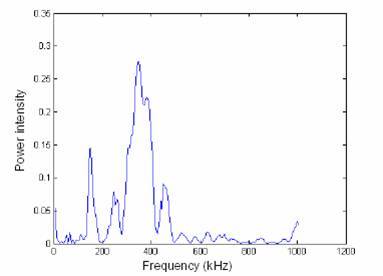
An example of a graph they might have is presented below (this is an illustration graph taken from wikipedia, ignore the axis labels):
![alt text][1]
For instance, and by inspection they are only interested in the 4 highest peaks that are clearly seen in the picture (the 2 neighbouring ones of the highest one and the other one slightly on the left).
So, my challenge was given the pairs <t, f(t)> I needed to devise a scheme to find all these “interesting peaks”.
I immediately had some ideas:
“You can use the derivative of the function and devise a sort of “hill climbing” algorithm where you only consider some peaks where the derivative in a very small neighbouring area is above a given value.”
“Good idea, but that doesn’t exclude the white noise points in the graph.”
Point taken, I thought… The noise was quite troublesome… So, I switched approach.
“How about doing sqrt decomposition? You divide your domain in sqrt(Domain Size) parts and successfully solve recursively for each part and merge the maximums of all parts to get sqrt(Domain Size) values which you can then cutoff as you please…”
At this point, I immediately realized that this wouldn’t work also, since the partitions can happen in “bad places” or near extreme values which could be accidentally left out…
Maybe using a sort of fixed distance to the peaks would rule out this “partition luck” factor, but I saw no practical use on it…
Then I thought about Simulated Annealing or on some heuristics but I’m unsure myself if this is of any help here…
Lastly, all I could think of was applying a sort of filter to eliminate all the noise and then perform a DFT on the filtered graph and sort the resulting oscilations to be above a given cutoff value, but, then again, I’m not sure if this helps…
So, if anyone can help me with this I’d be really glad.
PS: I know this is a bit of an ill-posed problem, but, to narrow it down, assume that what is wanted is all the peaks which are “interesting” and above a given cutoff value.
Bruno
[1]: http://discuss.codechef.com/upfiles/1486582_714574195232066_1266478383_n.jpg

